

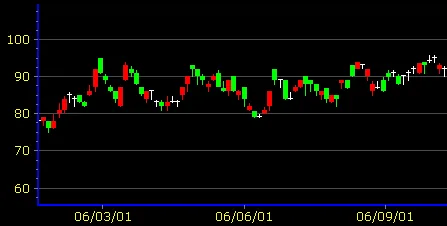

Ichimoku Cloud หรือ Ichimoku Kinko Hyo เป็นเครื่องมือที่มีหลายฟังก์ชัน ช่วยในการระบุระดับแนวรับและแนวต้าน ระบุทิศทางของแนวโน้มตลาด วัดโมเมนตัม และสร้างสัญญาณการซื้อขาย Ichimoku Kinko Hyo แปลว่า “แผนภูมิสมดุลที่ดูได้ในครั้งเดียว” ด้วยการดูเพียงครั้งเดียว นักวิเคราะห์สามารถระบุแนวโน้มและหาสัญญาณการซื้อขายได้ คลาวด์ (Kumo) เป็นคุณสมบัติที่เด่นที่สุดของแผนภูมิ Ichimoku Cloud และมักใช้ในการระบุแนวโน้มโดยรวม โมเมนตัมวัดอัตราการเปลี่ยนแปลงของราคาหลักทรัพย์ ดัชนีทางเทคนิคคือชุดข้อมูลที่ได้จากการประยุกต์ใช้สูตรกับข้อมูลราคาของหลักทรัพย์ ข้อมูลราคาประกอบด้วยการรวมกันของราคาเปิด, สูงสุด, ต่ำสุด หรือปิดในช่วงเวลาหนึ่ง ดัชนีสามารถใช้ทำนายทิศทางราคาในอนาคต แต่ไม่สามารถรับประกันความถูกต้อง ค่าเฉลี่ยเคลื่อนที่กรองสัญญาณสุ่มและให้มุมมองราคามาตรฐานมากขึ้น
ความหมายและเหตุผลที่ควรรู้
Ichimoku Cloud คืออะไร
Ichimoku Cloud หรือ Ichimoku Kinko Hyo เป็นเครื่องมือที่มีหลายฟังก์ชัน ช่วยในการระบุระดับแนวรับและแนวต้าน ระบุทิศทางของแนวโน้มตลาด วัดโมเมนตัม และสร้างสัญญาณการซื้อขาย Ichimoku Kinko Hyo แปลว่า “แผนภูมิสมดุลที่ดูได้ในครั้งเดียว” ด้วยการดูเพียงครั้งเดียว นักวิเคราะห์สามารถระบุแนวโน้มและหาสัญญาณการซื้อขายได้ คลาวด์ (Kumo) เป็นคุณสมบัติที่เด่นที่สุดของแผนภูมิ Ichimoku Cloud และมักใช้ในการระบุแนวโน้มโดยรวม โมเมนตัมวัดอัตราการเปลี่ยนแปลงของราคาหลักทรัพย์ ดัชนีทางเทคนิคคือชุดข้อมูลที่ได้จากการประยุกต์ใช้สูตรกับข้อมูลราคาของหลักทรัพย์ ข้อมูลราคาประกอบด้วยการรวมกันของราคาเปิด, สูงสุด, ต่ำสุด หรือปิดในช่วงเวลาหนึ่ง ดัชนีสามารถใช้ทำนายทิศทางราคาในอนาคต แต่ไม่สามารถรับประกันความถูกต้อง ค่าเฉลี่ยเคลื่อนที่กรองสัญญาณสุ่มและให้มุมมองราคามาตรฐานมากขึ้น
ประโยชน์ของ Ichimoku Cloud
Ichimoku Cloud ช่วยให้นักลงทุนและนักซื้อขายสามารถระบุแนวโน้มและแนวรับแนวต้านได้จากแผนภูมิเดียว ทำให้การวิเคราะห์ราคามีความสะดวกและรวดเร็วขึ้น คลาวด์ (Kumo) แสดงแนวโน้มโดยรวมของตลาด ซึ่งเป็นประโยชน์ในการตัดสินใจซื้อขาย โมเมนตัมวัดอัตราการเปลี่ยนแปลงของราคาหลักทรัพย์ ดัชนีทางเทคนิคคือชุดข้อมูลที่ได้จากการประยุกต์ใช้สูตรกับข้อมูลราคาของหลักทรัพย์ ข้อมูลราคาประกอบด้วยการรวมกันของราคาเปิด, สูงสุด, ต่ำสุด หรือปิดในช่วงเวลาหนึ่ง ดัชนีสามารถใช้ทำนายทิศทางราคาในอนาคต ค่าเฉลี่ยเคลื่อนที่กรองสัญญาณสุ่มและให้มุมมองราคามาตรฐานมากขึ้น
กลไกและองค์ประกอบสำคัญ
การคำนวณ Conversion Line และ Base Line
Conversion Line หรือ บรรทัดการแปลง คำนวณจากจุดกึ่งกลางของช่วงสูงสุดและต่ำสุดใน 9 วัน ซึ่งเกือบ 2 สัปดาห์ ในแผนภูมิรายวัน บรรทัดนี้จะติดตามการเคลื่อนไหวของราคาอย่างใกล้ชิด ทำให้มันเป็นบรรทัดที่ไวต่อการเปลี่ยนแปลงของราคา แต่ต้องระวังว่าการไวต่อการเปลี่ยนแปลงของราคาอาจทำให้เกิดสัญญาณที่ไม่แน่นอนในบางกรณี
Base Line หรือ บรรทัดฐาน คำนวณจากจุดกึ่งกลางของช่วงสูงสุดและต่ำสุดใน 26 วัน ซึ่งเกือบหนึ่งเดือน บรรทัดนี้จะตามหลัง Conversion Line แต่ยังคงติดตามการเคลื่อนไหวของราคาได้ดี
การคำนวณ Leading Span A และ Leading Span B
Leading Span B คำนวณจากจุดกึ่งกลางของช่วงสูงสุดและต่ำสุดใน 52 วัน ซึ่งเกือบสามเดือน บรรทัดนี้จะตามหลัง Leading Span A แต่ยังคงติดตามการเคลื่อนไหวของราคาได้ดี
การสร้าง Cloud (ก้อนเมฆ)
Cloud หรือ ก้อนเมฆ สร้างขึ้นเมื่อ Leading Span A ตัดกับ Leading Span B บริเวณระหว่างสองบรรทัดนี้จะถูกสีตามทิศทางของราคา ถ้า Leading Span A อยู่เหนือ Leading Span B แสดงว่าแนวโน้มเป็นขาขึ้น และบริเวณระหว่างสองบรรทัดจะถูกสีเขียว ถ้า Leading Span B อยู่เหนือ Leading Span A แสดงว่าแนวโน้มเป็นขาลง และบริเวณระหว่างสองบรรทัดจะถูกสีแดง
การใช้ Cloud ในการวิเคราะห์แนวโน้ม
Cloud สามารถใช้ในการวิเคราะห์แนวโน้มได้สองวิธี คือ ด้วยการเปรียบเทียบความสัมพันธ์ระหว่างราคาและ Cloud และด้วยการเปรียบเทียบความสัมพันธ์ระหว่างสองบรรทัดที่สร้าง Cloud
- ถ้าราคาอยู่เหนือ Cloud แสดงว่าแนวโน้มเป็นขาขึ้น
- ถ้าราคาอยู่ใต้ Cloud แสดงว่าแนวโน้มเป็นขาลง
- ถ้าราคาอยู่ใน Cloud แสดงว่าแนวโน้มเป็นขา.sideways
การใช้ Cloud ในการวิเคราะห์แนวโน้มทำให้สามารถระบุแนวโน้มที่ชัดเจนและเป็นสัญญาณที่ตรงไปตรงมาในการระบุแนวโน้ม
การนำไปใช้ในบริบทของผู้อ่าน
The Ichimoku Cloud is a comprehensive technical indicator that provides various insights into market dynamics. It is designed to identify levels of support and resistance, determine the direction of the market trend, measure momentum, and produce trading signals. The indicator was developed by journalist Goichi Hosoda and published in his 1969 book. It consists of five plots: the Conversion Line, the Base Line, the Leading Span A, the Leading Span B, and the Lagging Span. The cloud (Kumo) is the most prominent feature and is formed by the Leading Span A and Leading Span B lines. The cloud helps in identifying the overall trend, with the area between the two lines color-coded to indicate bullish (green) or bearish (red) conditions. The default settings for the Conversion Line and Base Line are 9 and 26 periods, respectively. Leading Span A is based on the average of the Conversion Line and Base Line and plotted 26 periods into the future. Leading Span B is based on the midpoint of the 52-day high-low range and plotted 26 periods into the future. The Lagging Span is the closing price plotted 26 periods in the past. By comparing the relationship between price and each of the plots, as well as the relationship between various plots, chartists can determine the trend and spot trading signals. The Ichimoku Cloud offers a multi-functional tool for technical analysis, providing a comprehensive view of market dynamics with one look.
ข้อจำกัด ความเสี่ยง และสิ่งที่ควรตรวจสอบ
The Ichimoku Cloud is a comprehensive technical indicator that provides various insights into market dynamics. It helps in identifying levels of support and resistance, figuring out the direction of the market trend, measuring momentum, and producing trading signals. The indicator was developed by journalist Goichi Hosoda and published in his 1969 book. The Ichimoku Cloud consists of five plots: the Conversion Line, the Base Line, the Leading Span A, the Leading Span B, and the Lagging Span. The Conversion Line is the midpoint of the 9-day high-low range, while the Base Line is the midpoint of the 26-day high-low range. The cloud (Kumo) is formed by the Leading Span A and Leading Span B, which are plotted 26 periods into the future. The area between these two lines is color-coded to indicate bullish (green) or bearish (red) trends. The Lagging Span line is simply the close plotted 26 days in the past. The Ichimoku Cloud plots can be used like moving averages to determine the trend and spot trading signals. The trend is up when prices are above the cloud, down when prices are below the cloud, and flat when prices are in the cloud. This indicator offers a unique perspective on the strength and direction of the underlying price action, and it can be used to alert, confirm, and predict market movements. However, it is important to consider the price action in conjunction with the indicator for a more comprehensive analysis.
สรุป
The Ichimoku Cloud is a comprehensive technical indicator that provides various insights into market dynamics. It helps in identifying levels of support and resistance, figuring out the direction of the market trend, measuring momentum, and producing trading signals. The indicator was developed by journalist Goichi Hosoda and published in his 1969 book. The Ichimoku Cloud consists of five plots: the Conversion Line, the Base Line, the Leading Span A, the Leading Span B, and the Lagging Span. The Conversion Line is the midpoint of the 9-day high-low range, while the Base Line is the midpoint of the 26-day high-low range. The Leading Span A and Leading Span B form the cloud, with the area between the two lines color-coded to indicate bullish or bearish trends. The cloud (Kumo) is a key feature of the Ichimoku Cloud plots and is often used to identify the overall trend. The Lagging Span line is just the close plotted 26 days in the past. The Ichimoku Cloud is a multi-functional tool that provides various insights into market dynamics and helps in identifying the trend and looking for potential signals.
แหล่งข้อมูล